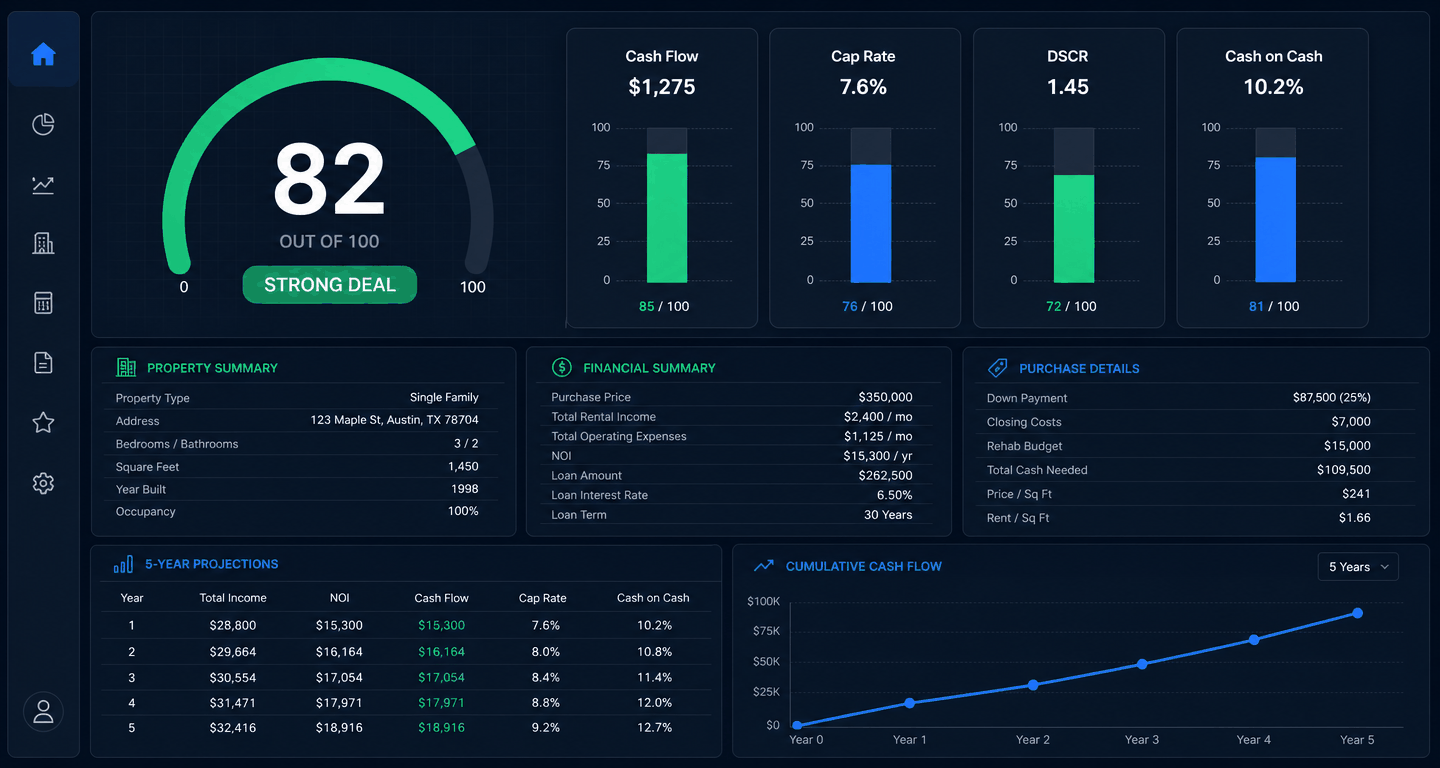
Every analyzed deal gets a 0 to 100 score. Each strategy uses its own strict, threshold-based rubric (no smoothed curves, all hard buckets), so two analysts running the same numbers always see the same score. It is not a guarantee, it is a fast way to compare deals on the same scale.
The rubric by strategy
Each analyzer scores the five metrics that matter most for that exit:
- Long-term rental (LTR): Cash-on-Cash (25 pts) + Cash Flow per Door (20) + DSCR (20) + Cap Rate (20) + 1% Rule (15).
- Short-term rental (STR): Cash-on-Cash (30) + DSCR (25) + Total ROI (20) + Monthly Cash Flow (15) + a checklist bonus of up to plus or minus 10 points from the 7-metric due-diligence check.
- BRRRR: Capital Left in Deal (30) + All-In to ARV (25) + Post-Refi CoC (20) + Post-Refi Monthly Cash Flow (15) + Post-Refi DSCR (10).
- Fix and flip: Profit Margin as % of ARV (30) + 70% Rule (25) + Net Profit (25) + Profit per Day (10) + Rehab Risk, rehab as % of price (10). DSCR is not scored because a flip is not a hold.
Verdict bands
Excellent
85–100
Strong numbers
Strong
70–84
Solid numbers
Fair
55–69
Marginal numbers
Weak / Poor
< 55
Renegotiate or move on
What the score does NOT capture
- Local rent growth or appreciation potential.
- Neighborhood trajectory and crime trends.
- Lender overlays and your personal DTI.
- Tax strategy (depreciation, cost segregation, 1031).