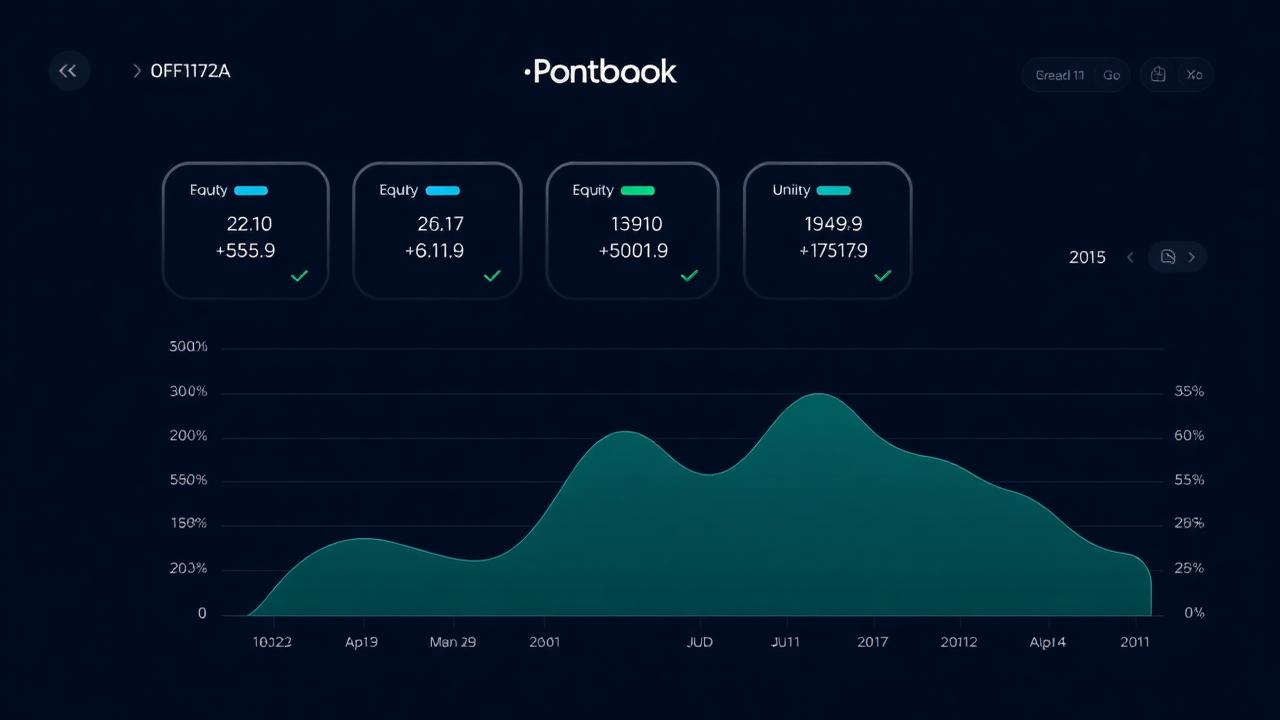
Portfolio is your live wealth dashboard. It aggregates every deal you've moved to Completed in the pipeline (plus any deals still marked Sold from a prior close) into a single set of KPIs. There is nothing to enter here directly. It reads from your saved deals, so keeping the underlying analyses accurate is the whole trick.
How a deal lands here
Any saved deal with a pipeline stage of Completed or Soldcounts as acquired and appears in Portfolio. The fastest way to get there is to drag a card into the Acquired dropzone in Pipeline. You can also change stage from the Deal Hub Drawer.
The six top-line KPIs
- Portfolio LTV. Total debt ÷ total value. Under 70% is comfortable.
- Portfolio DSCR. Blended NOI ÷ blended debt service. 1.25x or higher keeps banks happy.
Insights and charts
Below the KPIs, Portfolio charts the equity vs debt trajectory, cash flow by property, strategy mix, and holdings by market. Every chart pulls from the same saved-deal data, so edits in Omni flow into the dashboard the next time it re-renders.
Keeping the numbers honest
- Update the ARV field when a market moves. Portfolio Value uses ARV first, purchase price second.
- Log rent increases on the LTR side so blended cash flow reflects reality.
- Move a deal to Sold the day you close a sale so it stops padding the equity number.