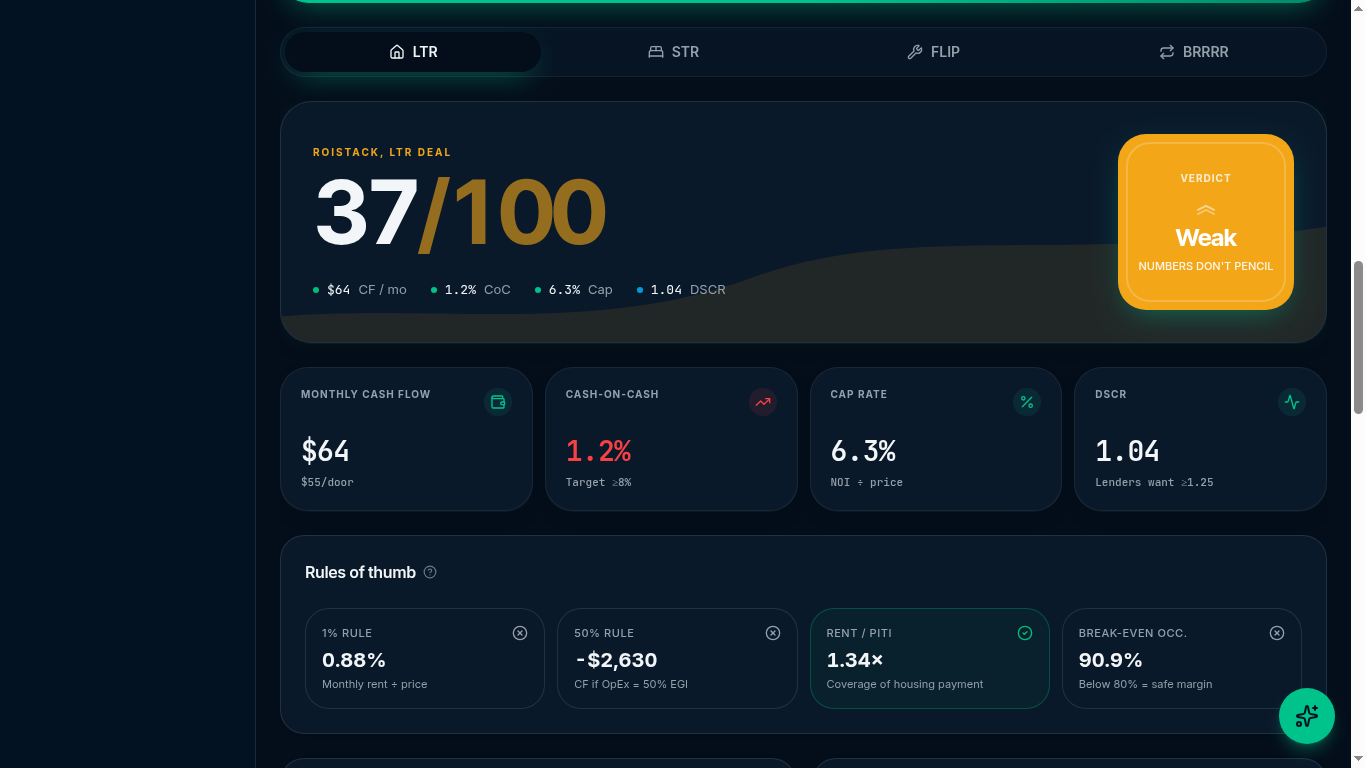
The LTR analyzer models a single-family or small multi-family property rented to a tenant on a 12-month lease. It's the right tool for traditional buy-and-hold investing.
Inputs explained
- Purchase price & down payment: what you'll pay and what you'll put down.
- Rate & term: defaults to a 30-year fixed; adjust to your quote.
- Monthly rent: use comps from Zillow Rent Estimate or local PMs.
- Taxes & insurance: pull from the county appraiser and an insurance quote.
- Vacancy %: 5 to 8% is typical for stable US markets.
- Maintenance % / CapEx %: 5 to 10% each, more on older properties.
- Property management: 8 to 10% of collected rent if you're not self-managing.
How the math works
- NOI = (Rent × (1 − vacancy)) − operating expenses.
- Cap rate = NOI ÷ purchase price.
- Cash flow = NOI − annual debt service.
- Cash-on-cash = annual cash flow ÷ total cash invested.
- DSCR = NOI ÷ annual debt service.
Reading the results
Cash flow
≥ $200
Per door, per month
Cap rate
≥ 6%
Competitive in 2026
DSCR
≥ 1.25
Comfortable for lenders