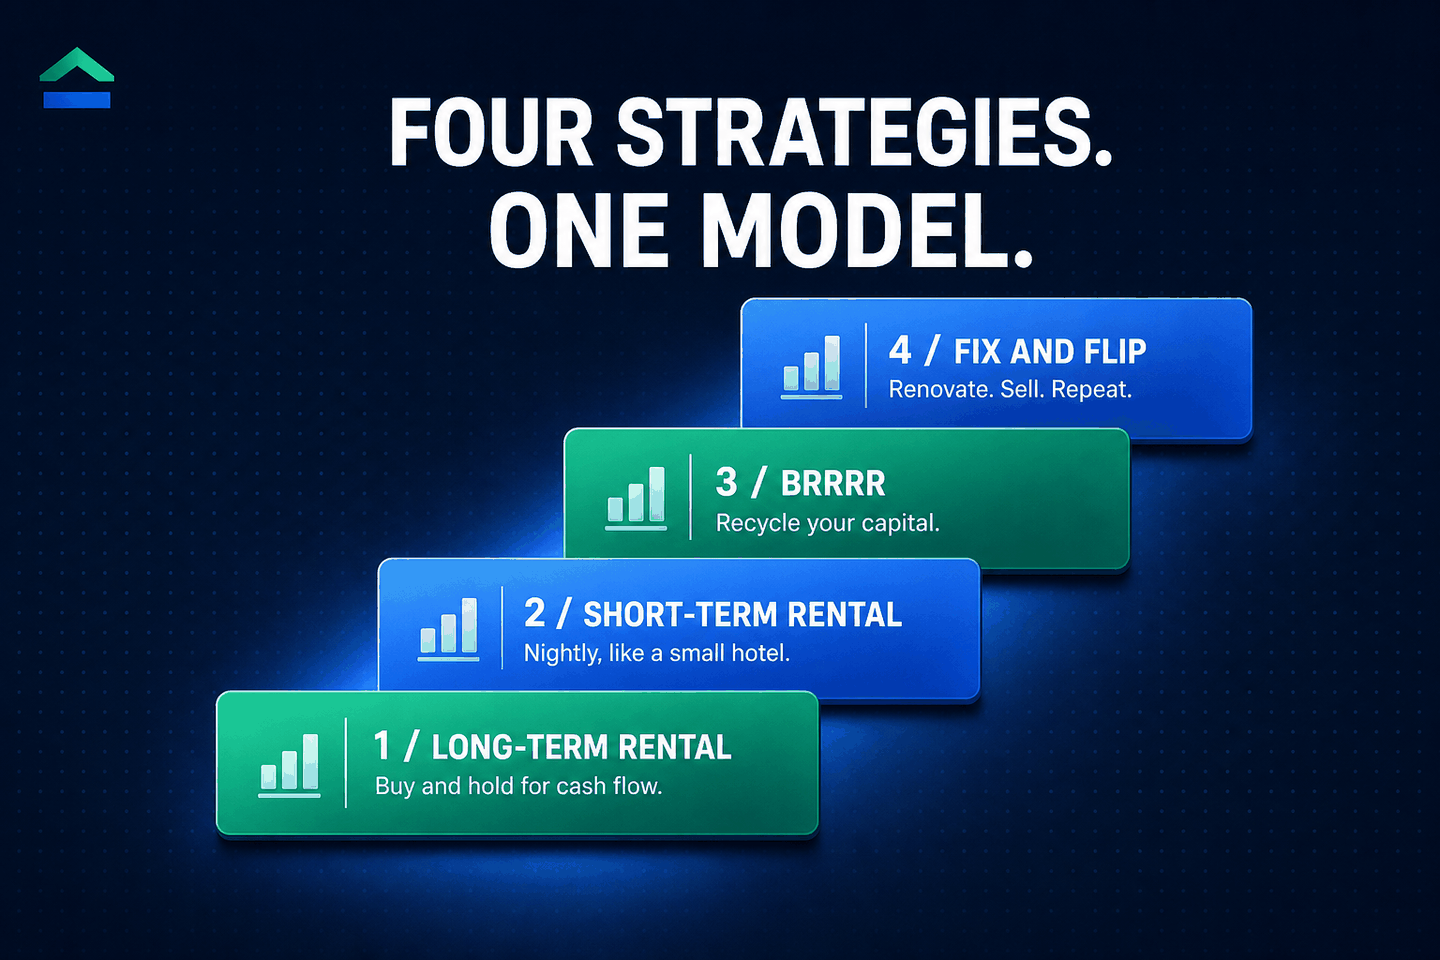
Most "which strategy is best" arguments online skip the part that actually decides the outcome: the property in front of you.
A real estate deal is just a cash-flow problem with rules. The rules change depending on whether you rent the property by the year, by the night, refinance it to recycle your cash, or renovate it and sell. Same building, four different cash-flow shapes. The point of this guide is to make the trade-offs legible so you can pick the right one for your capital, your time, and your risk appetite, instead of inheriting whichever strategy your loudest YouTube subscription is selling this week.
Every worked example below uses the same property: a 3 bed, 2 bath, 1,520 square foot single-family home built in 1978 on the west side of San Antonio, ZIP 78228. Asking price $218,000. Property taxes $5,175 per year (Bexar County effective rate of about 2.3%). Long-term rent comps land at $1,800 per month. Short-term comps land at $128 ADR. The last recorded sale was $184,500 in March 2022. These numbers are the real RentCast bands for the market. Nothing made up.
Run the same property through four lenses and you get four very different stories. That contrast is the whole lesson.
The whole picture, in one table
Lower is calmer, higher is hotter.Long-term rental (LTR)
Buy a property, sign a 12 month lease, collect rent every month.
How it works
A long-term rental is the most boring, and the most forgiving, of the four. You buy a property, sign a 12 month lease, and collect rent every month. The tenant pays for most of your fixed costs while inflation slowly raises both your rent and your property value. The asset compounds in the background.
The whole game is making sure the rent actually covers the bills with a buffer left over. That sounds obvious. It is not obvious. Most new investors underwrite an LTR by adding up principal, interest, taxes, and insurance, and stopping there. They forget vacancy (because no tenant is in place 100% of the time), maintenance (because nothing is new forever), capex (because the roof eventually goes), and property management (because your time is not free).
Translation: rent minus mortgage is not cash flow. Rent minus mortgage minus 25 to 30 percent of gross rent for the rest of life's surprises, that is closer to cash flow.
- Net operating income. The income the property produces before any loan payments.
- Unleveraged yield. How the property would perform if you paid cash.
- What lands in your account after the lender is paid.
- Your real-world annual return on the dollars you actually put up.
- Debt service coverage ratio. Lenders want 1.20 or higher.
Worked example
Real demo dealA 3 bed, 2 bath, 1,520 sqft single-family on the west side of San Antonio (ZIP 78228). Run end-to-end through LTR.
- Purchase price
- $218,000
- Down payment
- $54,500
- Closing costs
- $6,540
- Total cash in
- $61,040
- Monthly rent
- $1,800
- Monthly PITI
- $1,697
- NOI per year
- $10,089
- Cap rate
- 4.6%
- Annual cash flow
- -$3,291
- Conventional 30 year financing is the cheapest debt in real estate.
- Tenants on annual leases mean low operating intensity.
- Predictable monthly cash flow once stabilised.
- Tax depreciation shelters paper income from day one.
- Easiest strategy to scale to a portfolio of 10 plus doors.
- Lowest yield of the four strategies on a cash-on-cash basis.
- Negative or breakeven cash flow is normal in 2026 high-rate markets.
- Capex events (roof, HVAC, sewer) can wipe out a year of cash flow.
- Hard to add value once the deal is stabilised.
- You want something that does not need you every week.
- You can leave 20 to 25% in the deal for a long time.
- You are betting on appreciation and tax benefits, not yield.
- Your market has stable rent growth and low vacancy.
At asking price the LTR math is tight. A 4.6% cap rate sits below the cost of debt in 2026, so leverage works against the return. DSCR lands at 0.75 (under 1.0, which is the line most lenders draw). The same property would pencil differently at a lower basis (around $185k), with a larger down payment, or in a market with stronger rent growth than this ZIP carries. This is exactly the kind of contrast a single-glance pro forma can hide.
Short-term rental (STR)
Rent a property nightly through Airbnb or VRBO, run it like a small hotel.
How it works
A short-term rental is a small hospitality business that happens to own real estate. Instead of a single annual tenant you have dozens of guests per year, each staying for a handful of nights. The headline revenue is two to three times what the same property would earn as a long-term rental, but you give back a real chunk of that to platform fees, cleaning turnovers, utilities, supplies, short-term-rental insurance, and either your time or a property manager.
Translation: an STR converts time and operational risk into yield. If you are willing to manage messages at 11pm and have a backup cleaner on speed dial, you can sometimes double the cash flow of an LTR on the same building. If you are not, a property manager taking 20 to 25 percent of net revenue often eats the entire delta.
The other thing nobody tells you: regulation risk is real. Cities pass STR ordinances every quarter and an overnight rule change can convert your STR into an LTR whether you wanted that or not.
- The top line, before any fees come out.
- What actually shows up in your account from the platform.
- Revenue per available night. The single best comp metric.
- Includes utilities, supplies, STR insurance, and management.
- Does it still survive if the market softens 15 percentage points?
Worked example
Real demo dealA 3 bed, 2 bath, 1,520 sqft single-family on the west side of San Antonio (ZIP 78228). Run end-to-end through STR.
- ADR
- $128
- Occupancy
- 60%
- Annual gross
- $28,032
- After platform fees
- $24,108
- Operating expenses
- $17,300
- NOI per year
- $6,808
- Cash flow vs LTR
- Lower
- RevPAR
- $77/night
- Stress test (45% occ)
- Underwater
- Top-line revenue 2 to 3 times the LTR equivalent in good markets.
- Pricing flexibility: raise ADR for events, peak weeks, holidays.
- Tax benefit: cost-segregation studies are common on STRs.
- Personal use option (limited) is built into the model.
- Higher operating expenses eat most of the revenue delta.
- Active management or 20 to 25% to a co-host.
- Regulation risk: one ordinance can zero the deal overnight.
- Revenue ramps over a season, not month one.
- Your market is tourist-friendly or business-travel heavy.
- Local STR rules are stable and you can pull a permit.
- You are willing to operate the property or pay someone who will.
- You can fund 4 to 6 months of carrying costs while it ramps.
BRRRR (Buy, Rehab, Rent, Refinance, Repeat)
Force appreciation with a rehab, refinance most of your cash out, recycle it into the next deal.
How it works
BRRRR is a structural trick. You buy a property that needs work, renovate it to force the appraised value up, rent it out for the lender's seasoning period (usually six months), and then refinance into a long-term loan based on the new, higher value. The refi pulls most of your acquisition cash back out. You repeat with the same dollars.
Translation: BRRRR is how investors with $50,000 build portfolios that look like investors with $500,000 built them. The catch is that every step in the acronym is where the deal usually breaks. You miss on the rehab budget. The appraiser comes in 8% under your ARV. The new monthly payment is bigger than the rent supports. Cash left in deal balloons. You ran a BRRRR but the property consumed your capital instead of recycling it.
- Every dollar in by refi day.
- Lender's max long-term loan. Typically 75% of appraisal.
- Total outlay includes initial cash + holding costs. Cash out from refi already nets refi closing costs.
- How fast the same dollar can do another deal.
- Must clear 1.20 or the deal does not work as a rental.
Worked example
Real demo dealA 3 bed, 2 bath, 1,520 sqft single-family on the west side of San Antonio (ZIP 78228). Run end-to-end through BRRRR.
- Negotiated buy
- $185,000
- Rehab budget
- $40,000
- Holding costs
- $8,000
- All-in basis
- $233,000
- Forced ARV
- $290,000
- Refi at 75% LTV
- $217,500
- Cash left in deal
- $15,500
- Post-refi PITI
- $2,001/mo
- Post-refi cash flow
- -$201/mo
- Recycles most of your capital out within 6 to 9 months.
- Theoretical infinite return when all the cash comes back.
- Forces equity through the rehab, not the market.
- Builds a stabilised rental as a byproduct.
- Three places to be wrong at once: rehab cost, ARV, and stabilised rent.
- Appraisal risk is real; lenders are conservative in soft markets.
- Higher all-in cost than a straight purchase means tighter post-refi cash flow.
- Requires bridge or hard money during the rehab and seasoning period.
- You have a contractor you trust and a rehab scope, not a wish.
- Your comps support an ARV at least 25% above your all-in basis.
- You can carry hard money for 6 to 9 months without panic.
- Stabilised rent supports DSCR above 1.20 on the refinanced loan.
At a $185k purchase and a $40k rehab the model pushes ARV to $290k, recovers most of the cash, and leaves roughly $15,500 stuck in the property. That qualifies as a "true BRRRR" in most operators' vocabulary. Post-refi cash flow is slightly negative because San Antonio rent in this ZIP does not support the higher basis, while $57k of equity is built in six months and rent typically catches up over a few annual escalations. That is the trade the math describes; whether it fits a given operator is a separate question.
Fix and flip
Buy distressed, renovate, sell at retail. Treat it as a job, not an investment.
How it works
A flip is a manufacturing job dressed up as real estate. You buy distressed inventory, renovate it to retail finish, and sell it at the higher price. The profit is the spread between the ARV and the sum of every cost line (purchase, rehab, holding, financing, selling costs).
Translation: a flip is active income, not investing. You do not own a cash-flowing asset at the end of it. You own a check, and if you do not start another flip immediately the money is just sitting there. The whole strategy survives on the 70% rule (max offer equals 70% of ARV minus rehab) because that built-in margin is what absorbs the inevitable cost overrun and comp drift.
- Every dollar spent on the project. Selling costs are netted from proceeds, not added here.
- Pre-tax. Net proceeds = ARV − selling costs − concessions − staging.
- 15% or higher buffers a 5 to 10 point comp drift.
- Back-of-the-envelope max bid for a typical flip.
- Lets you compare a 4 month flip to a 9 month flip honestly.
Worked example
Real demo dealA 3 bed, 2 bath, 1,520 sqft single-family on the west side of San Antonio (ZIP 78228). Run end-to-end through Flip.
- Purchase price
- $185,000
- Rehab budget
- $32,000
- Holding (4 mo)
- $9,500
- Hard money interest
- $7,300
- ARV
- $290,000
- Selling costs (8%)
- $23,200
- Total cost basis
- $257,000
- Gross profit
- $33,000
- Annualised ROI
- ~62%
- Lump-sum profit in 4 to 8 months instead of 4 to 8 years.
- No long-term financing exposure or tenant management.
- Forces real construction and pricing skill that transfers to BRRRR.
- Higher reliable yield than LTR per dollar of work.
- Active income, taxed as such; no depreciation shelter.
- Construction risk, contractor risk, and market risk all at once.
- You stop earning the moment you stop working.
- Hard money rates plus points compress margin fast if you go over schedule.
- You can underwrite ARV from 3 or more sold comps within 6 months.
- You have a contractor, a backup contractor, and a real scope.
- Your market days-on-market are under 60 and stable.
- You can take taxable active income this year without it changing your bracket badly.
Same building, four different stories.
The same San Antonio property reads as a weak LTR, a marginal STR, a barely-true BRRRR, and a clean fix-and-flip with $33k of modeled upside. Four lenses, four different answers. Running the math more than one way is how the deal hiding inside a property tends to surface.
Three questions, one closest fit.
Educational only. A quick way to see which strategy profile most closely matches how you answered.
How involved do you want to be week-to-week?
The questions investors actually ask.
Estimates only, based on the inputs you provide and third-party data. Not investment, tax, accounting, or legal advice. See our full disclaimer.