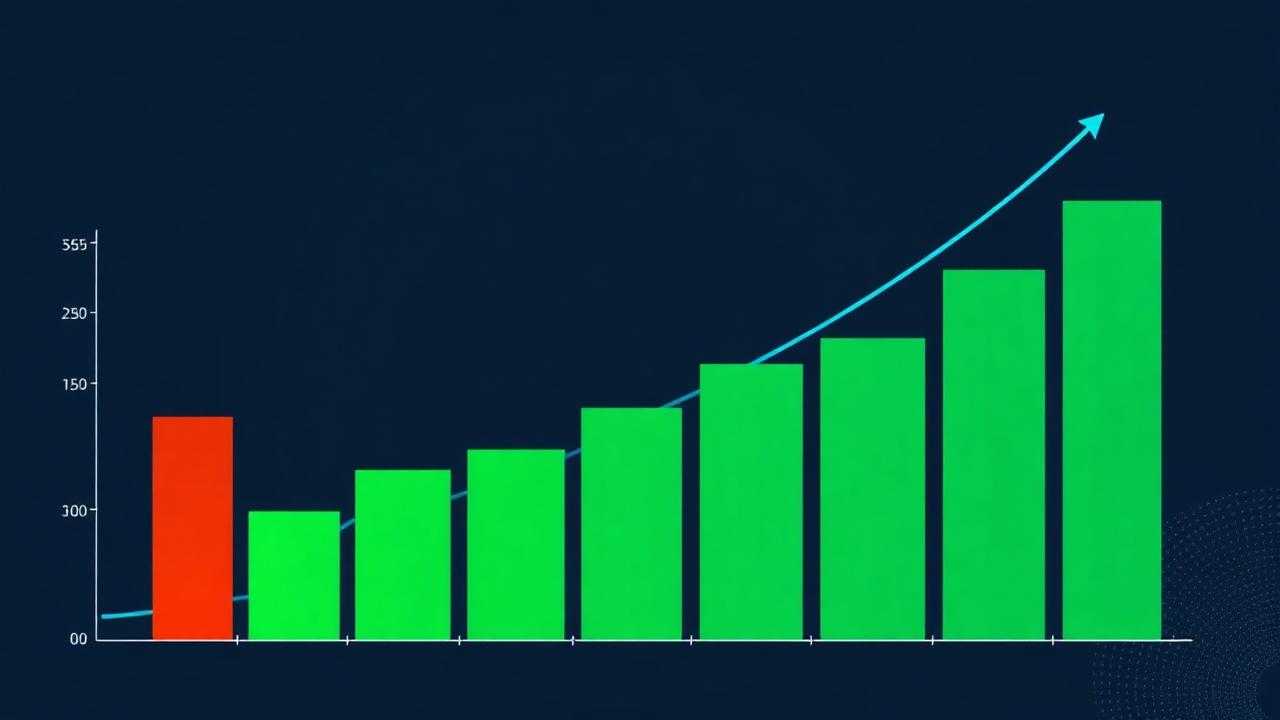
Internal Rate of Return (IRR) is the single best number for comparing real estate deals that play out over multiple years. It folds together cash flow, debt paydown, appreciation, and your exit proceeds into one annualized percentage. If you are serious about honest math, IRR is the metric to trust.
The time value of money
A dollar today is worth more than a dollar five years from now. That idea is the entire foundation of IRR. The calculation asks: "What discount rate would make the present value of every future cash flow equal to the cash I put in today?"
In practical terms, if you invest $50,000 upfront and collect uneven cash flows for ten years before selling, IRR is the interest rate that would make that exact stream of inflows and outflows break even. No guesswork. No napkin math.
IRR versus Cash-on-Cash return
Cash-on-Cash (CoC) is simple: one year of cash flow divided by cash invested. It is useful for a quick sanity check, but it ignores three critical things.
- Time. CoC treats year-one cash flow the same as year-ten cash flow. IRR does not.
- Reinvestment. CoC says nothing about what you do with distributions along the way. IRR assumes they are reinvested at the same rate.
- Exit. CoC ignores your sale proceeds, loan payoff, and accumulated equity. IRR bakes them all in.
A deal with a 10% CoC but flat rents and no appreciation might underperform a deal with an 8% CoC, rising rents, and strong appreciation when you look at the full IRR picture.
What goes into the calculation
To compute IRR by hand, you need every cash flow in and out, dated correctly. For a typical rental that looks like this:
- Year 0 (today): negative cash for down payment, closing costs, and rehab.
- Years 1 through N: annual cash flow after all operating expenses and debt service.
- Year N (exit): net sale proceeds after paying off the remaining loan balance and selling costs, plus that final year of cash flow.
You then solve for the rate r that makes the net present value (NPV) of that entire stream equal to zero. Because the equation has no algebraic shortcut, you solve it iteratively (Newton-Raphson or bisection). The result is your IRR.
How ROIStack automates this
You do not need a spreadsheet. ROIStack builds the full cash-flow stream automatically from your deal inputs.
- Revenue growth: rent or ADR escalates by the trend rate you set.
- Expense growth: operating expenses inflate by your expense growth assumption.
- Debt paydown: principal and interest are amortized month by month, so loan balance is exact.
- Appreciation: property value grows by your appreciation rate, driving exit proceeds.
- Sale costs: selling costs (commissions, fees) are deducted from the final sale price.
The projection engine feeds that exact stream into an IRR solver, then displays the result alongside equity multiple, total cash flow, and sale proceeds. You get the full picture in seconds, not hours.
Reading the results
These benchmarks assume conventional leverage and moderate appreciation. A value-add deal with heavy rehab might target a higher IRR over a shorter hold. A core stabilized property might trade a lower IRR for lower risk. The point is to compare apples to apples, and IRR is the only metric that does.